General Information
Industry Employment
The data represented below shows the Industry, Occupations , and Classification of the number of employed civilian persons 16 years of age or older within Cowley County between the years 2019 and 2023.
| Industry | 2019 | 2020 | 2021 | 2022 | 2023 | 2024 |
|---|---|---|---|---|---|---|
| Estimated Employed Total | 15,488 | 15,562 | 15,158 | 15,273 | 15,226 | |
| Agriculture | 4.0 | 3.7 | 4.7 | 4.3 | 4.3 | |
| Construction | 4.6 | 5.2 | 5.4 | 4.8 | 5.2 | |
| Manufacturing | 20.9 | 20.2 | 19.1 | 18.3 | 17.1 | |
| Wholesale Trade | 2.5 | 1.9 | 1.6 | 1.4 | 1.4 | |
| Retail Trade | 9.3 | 9.5 | 9.3 | 9.7 | 9.8 | |
| Transportation and Warehousing | 5.0 | 5.4 | 5.6 | 5.7 | 6.3 | |
| Information | 1.2 | 1.4 | 1.3 | 1.2 | 1.1 | |
| Finance and Insurance | 3.2 | 4.0 | 4.7 | 4.5 | 5.0 | |
| Professional, Scientific Management, Administrative, and Waste Management | 4.3 | 3.6 | 4.0 | 4.3 | 5.2 | |
| Educational Services, Health Care, and Social Assistance | 27.3 | 28.4 | 27.6 | 29.4 | 27.8 | |
| Arts, Entertainment, Recreation, Accommodation, and Food Services | 8.7 | 7.5 | 7.6 | 7.4 | 8.1 | |
| Other Services, except Public Administration | 4.6 | 5.2 | 4.7 | 4.5 | 4.1 | |
| Public Administration | 4.5 | 4.0 | 4.4 | 4.6 | 4.6 |
| Occupation | 2019 | 2020 | 2021 | 2022 | 2023 | 2024 |
|---|---|---|---|---|---|---|
| Estimated Employed Total | 15,488 | 15,562 | 15,158 | 15,273 | 15,226 | |
| Management, business, science, and arts | 29.7 | 32.6 | 32.2 | 32.5 | 34.4 | |
| Services Occupations | 20.5 | 18.1 | 19.2 | 19.6 | 19.0 | |
| Sales and office occupations | 17.9 | 17.2 | 18.4 | 16.9 | 16.0 | |
| Natural resources, constructions, and maintenance | 11.3 | 11.6 | 11.2 | 11.7 | 11.4 | |
| Productions, transportation, and material moving | 20.7 | 20.5 | 19.0 | 19.4 | 19.1 |
| Class of Worker | 2019 | 2020 | 2021 | 2022 | 2023 | 2024 |
|---|---|---|---|---|---|---|
| Estimated Employed Total | 15,488 | 15,562 | 15,158 | 15,273 | 15,226 | |
| Private Wage and Salary Workers | 74.3 | 73.1 | 71.9 | 71.6 | 72.8 | |
| Government Workers | 19.0 | 18.7 | 19.7 | 19.7 | 19.1 | |
| Self-Employed, not incorporated | 6.5 | 8.0 | 8.3 | 8.6 | 8.1 | |
| Unpaid Family Workers | 0.2 | 0.2 | 0.1 | 0.1 | 0.1 |
U.S. Census Bureau. "Selected Economic Characteristics." American Community Survey, ACS 5-Year Estimates Data Profiles, Table DP03, 2019, 2020, 2021, 2022, https://data.census.gov/table/ACSDP5Y2023.DP03?t=Industry&g=050XX00US20035. Accessed on March 13, 2025.
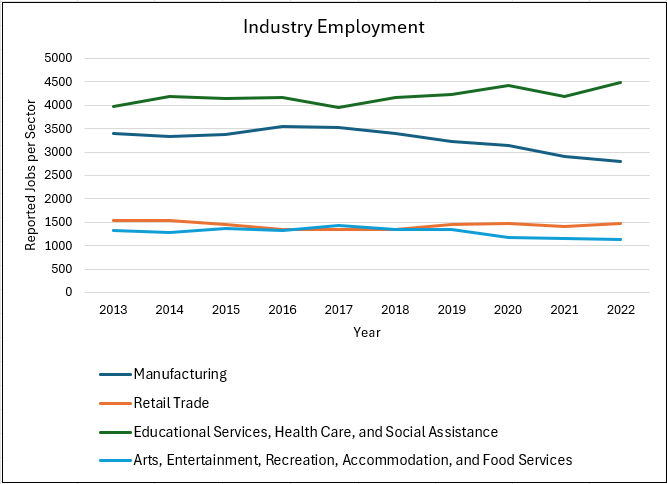
Industry Employment Chart
The data represented below shows the four major industries in Cowley County held by employed civilian persons age 16 years or older from 2013 to 2022.
U.S. Census Bureau. "Selected Economic Characteristics." American Community Survey, ACS 5-Year Estimates Data Profiles, Table DP03, 2019, 2020, 2021, 2022, https://data.census.gov/table/ACSDP5Y2022.DP03?t=Industry&g=050XX00US20035. Accessed on March 20, 2024.